
Sales pipeline coverage is the ratio of your open pipeline value to your revenue target for a given period. It tells you, at a glance, whether you have enough qualified opportunities in motion to hit the number. Most teams treat a moderate multiple of their revenue target as directionally healthy coverage, but the right target comes from your own win rate, not a borrowed rule. Check your unweighted coverage for this quarter today, before you trust the forecast built on top of it.
TL;DR:
- A healthy pipeline coverage ratio highly depends on your win rate; for example, 4x coverage suits a team with a 25% win rate, but longer sales cycles require higher multiples.
- Relying on unqualified or stale deals inflates coverage and can mask a genuine pipeline gap, making regular hygiene checks essential for accurate assessment.
- Weighted coverage offers a forecast-oriented view, but it should be tracked separately from unweighted potential to plan capacity effectively.
- Improving upstream qualification through AI-driven outreach reduces the need for excessive pipeline volume and lowers the coverage multiple required to meet revenue targets.
- Weekly pipeline inspections, segment-specific targets, and discipline in deal updating are crucial for maintaining reliable, actionable coverage metrics.
Table of Contents
- What Sales Pipeline Coverage Measures (And Why It Matters)
- How to Calculate Pipeline Coverage: Step-By-Step
- Weighted vs. Unweighted Coverage: What Each One Tells You
- How Much Pipeline Coverage Do You Actually Need?
- What Your Coverage Number Is Actually Telling You
- The Weekly Playbook for Managing Pipeline Coverage
- How Often You Should Measure and Report Coverage
- Four Common Pipeline Coverage Mistakes and How to Fix Them
- How Better Upstream Qualification Cuts Your Coverage Requirement
- Coverage Is a Trigger, Not a Comfort Blanket
- Book Qualified Meetings Without Inflating Your Pipeline Numbers
- Sources
- FAQ
What Sales Pipeline Coverage Measures (And Why It Matters)
Pipeline coverage compares total open pipeline in a period to the revenue you need to close in that same period. The base formula is simple: coverage ratio = total open pipeline value ÷ revenue target. A team with a multiple of their revenue target in open pipeline is sitting at a coverage ratio that may be typical for many organizations.
The number gets murkier once you ask which pipeline counts. Open pipeline usually means anything past a qualification gate, but plenty of teams inflate the ratio by including deals that never should have entered the funnel. That is why coverage must be read alongside close period, deal source, and segment, rather than as a single global figure, according to RevOps guidance on pipeline metrics.
Two distinctions matter before you calculate anything:
- Open vs. qualified pipeline. Only deals that have passed a real qualification step belong in the ratio. Everything earlier is a lead, not pipeline.
- Unweighted vs. weighted coverage. Unweighted sums raw deal values; weighted multiplies each deal by its stage probability, producing a smaller, more conservative number.
Coverage is a planning signal, not a guarantee. It misleads badly when the pipeline behind it is stale, single threaded, or dated to the wrong close period.
How to Calculate Pipeline Coverage: Step-By-Step
Calculating pipeline coverage takes four steps, and you can run the math in a spreadsheet in under ten minutes if your CRM data is clean.
- Pick your measurement period. Quarterly is standard for forecasting; monthly works for fast-cycle motions. Lock the period before you pull numbers, or you will compare deals closing in different windows.
- Set your counting rules. Decide whether renewals and expansions count as pipeline or as a separate bucket. Most B2B teams exclude renewals from new-business coverage because they distort the ratio toward false safety.
- Sum qualified open deals for that period. Pull every opportunity with a close date inside the window and a stage past your qualification gate.
- Divide by the revenue target. The result is your coverage ratio.
Here are three worked examples:
- A team with a $1,000,000 quarterly target and $3,500,000 in qualified open pipeline is at 3.5x coverage.
- A team targeting $250,000 for the month with $1,200,000 in qualified pipeline sits at 4.8x.
- A team with a $600,000 target and only $1,100,000 in pipeline is at 1.8x, a clear shortfall against any 3x-and-up benchmark.
If your business runs meaningful expansion revenue, calculate coverage twice: once for new business, once combined. Blending the two without labeling them hides which engine is actually underperforming.
Weighted vs. Unweighted Coverage: What Each One Tells You
Unweighted coverage sums the full value of every open deal, with no discount for how likely it is to close. It answers a capacity question: do you have enough raw opportunity volume in the funnel to hit the number, assuming a reasonable conversion rate? It's the number sales leaders should use when deciding whether to invest in more pipeline generation.
Weighted coverage multiplies each deal by its stage probability before summing, which produces a smaller, more forecast-realistic figure. Operational guidance on weighted versus unweighted pipeline treats the two as complementary, not interchangeable.
- Use unweighted coverage for capacity planning, hiring decisions, and answering "do we have enough shots on goal."
- Use weighted coverage as a sanity check against your forecast commit.
Pro Tip: Never apply a probability discount to a coverage ratio that was already built from weighted pipeline. That double-counts risk and makes a healthy quarter look thin.
How Much Pipeline Coverage Do You Actually Need?
The fastest way to derive a defensible target is to invert your win rate: required coverage ≈ 1 ÷ win rate. A team that closes 25% of qualified opportunities needs roughly 4x coverage. A team converting at 33% can operate closer to 3x, per the standard coverage formula used across sales operations resources.
That math produces very different numbers depending on your motion:
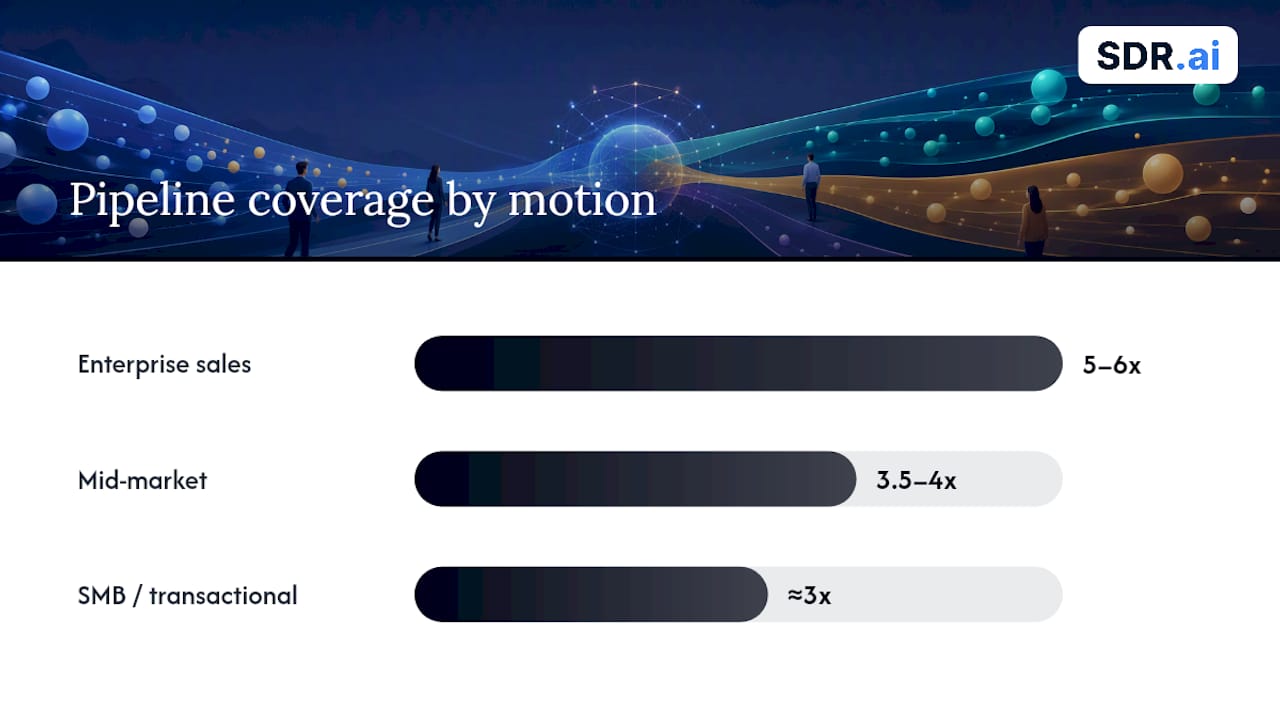
- Enterprise sales, with longer cycles and win rates often in the 15% to 20% range, tends to need coverage closer to 5x to 6x.
- Mid-market motions, with win rates around 25%, land comfortably in the 3.5x to 4x range that most guides cite as typical, a range HubSpot's coverage benchmarks reflect as well.
- SMB and transactional sales, with win rates of 30% or higher and short cycles, can often run at 3x or slightly below.
Adjust further for context. A new rep still ramping needs more coverage cushion than a tenured rep with a proven close rate. A segment entering a seasonally slow buying period needs extra pipeline built in advance, not discovered in week ten of the quarter. And a source with historically low conversion, cold outbound lists bought in bulk, for instance, should be weighted down even before you calculate the ratio, since its "qualified" label may not hold up.
What Your Coverage Number Is Actually Telling You
A coverage ratio only becomes useful once you know how to read the pattern behind it. Four situations show up constantly, and each calls for a different response.
- High coverage, low win rate. This usually means qualification is broken, not that you have too little pipeline. HubSpot's coverage guidance flags ratios above roughly 6x as a red flag for exactly this reason: inflated deal counts, not real opportunity.
- Low coverage, normal win rate. A genuine pipeline generation gap. More outbound activity, not process changes, is the fix.
- Healthy coverage, heavy stage aging. Deals are sitting in your CRM without close-date discipline. The ratio looks fine on paper and lies in practice.
- Segment mismatch. Blended coverage across enterprise and SMB segments can look adequate while one segment is dangerously thin.
Run three inspections before trusting any coverage number: check stage mix for lopsided concentration in early stages, flag deals with no activity in 14 days or more, and scan for close dates that have moved more than once this quarter.
Coverage above roughly 6x commonly signals a qualification problem rather than a safety margin, since deals that shouldn't have entered the pipeline still count toward the ratio.
From there, the decision is binary: generate more pipeline, tighten qualification criteria, or revise the forecast now while there's still runway to act on it.
The Weekly Playbook for Managing Pipeline Coverage
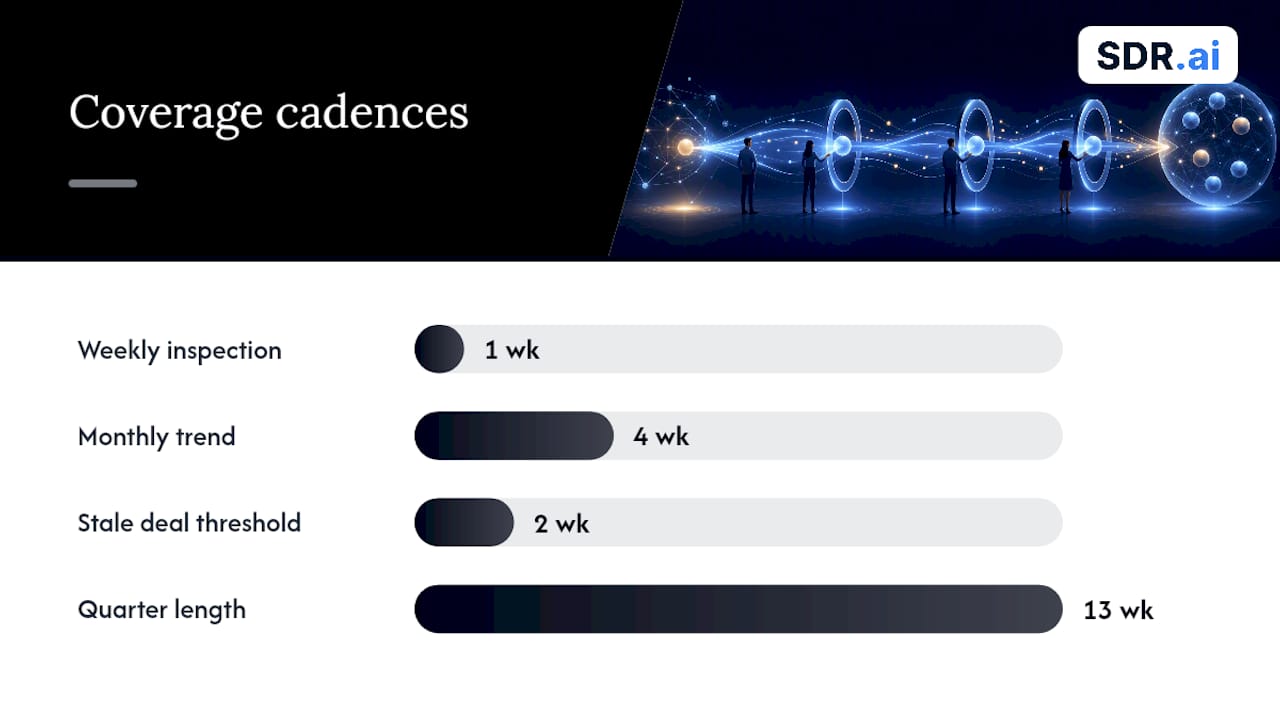
Coverage management is a weekly discipline, not a quarterly fire drill. Pipeline inspection best practices recommend hygiene checks every week and trend analysis monthly, precisely because coverage gaps discovered in week eleven of a thirteen-week quarter are gaps you can no longer close.
Weekly manager checklist:
- Review every deal with a close date in the current period for stage accuracy and next-step clarity.
- Flag stale deals (no movement in two weeks) for a stay-or-kill decision.
- Check new pipeline created against the weekly pace needed to hit the period's coverage target.
Generating qualified pipeline takes more than adding activity volume. Targeted outbound through LinkedIn and account-based approaches tends to produce higher-quality opportunities than blanket cold calling, because it starts from intent signals rather than a purchased list. Partner-sourced pipeline and layered automation, the kind outlined in a marketing automation checklist for growing teams, can supplement rep-generated pipeline without adding headcount.
Deal acceleration means escalating stalled opportunities to a manager or exec sponsor before they age past the point of recovery, not after.
Pro Tip: Set coverage targets by segment, not company-wide. A single blended number hides which segment is actually short.
Align every target with sales capacity. A coverage ratio that assumes headcount you don't have yet is a forecast built on a plan, not a pipeline.
How Often You Should Measure and Report Coverage
Coverage needs a cadence, or it becomes a number people quote from memory instead of from the CRM. Run weekly operational checks focused on current-period risk, monthly trend reviews to catch drift in source or segment mix, and a full reset at the start of each quarter using updated win rates.
A minimal coverage dashboard should include:
- Unweighted coverage ratio
- Weighted coverage ratio
- Historical win rate by segment
- New pipeline created vs. weekly pace needed
- Stage aging and stale deal count
- Close-date movement over the trailing 30 days
Slice every one of these by close period, segment, lead source, and rep or team. A company-wide average coverage figure can look perfectly healthy while two segments are dangerously exposed and one is wildly overbuilt.
Four Common Pipeline Coverage Mistakes and How to Fix Them
- Counting stale or single-threaded deals. A deal with no activity in three weeks and one contact isn't real pipeline. Purge it before calculating coverage, not after.
- Using the wrong close period. Deals dated to next quarter still inflate this quarter's ratio if nobody enforces close-date discipline. Audit close dates weekly.
- Applying a blanket 3x rule with no calibration. The 1 ÷ win rate math exists specifically so you stop borrowing someone else's benchmark.
- Confusing weighted pipeline with coverage. Weighted figures answer a forecasting question; coverage answers a capacity question. Track both, separately.
How Better Upstream Qualification Cuts Your Coverage Requirement
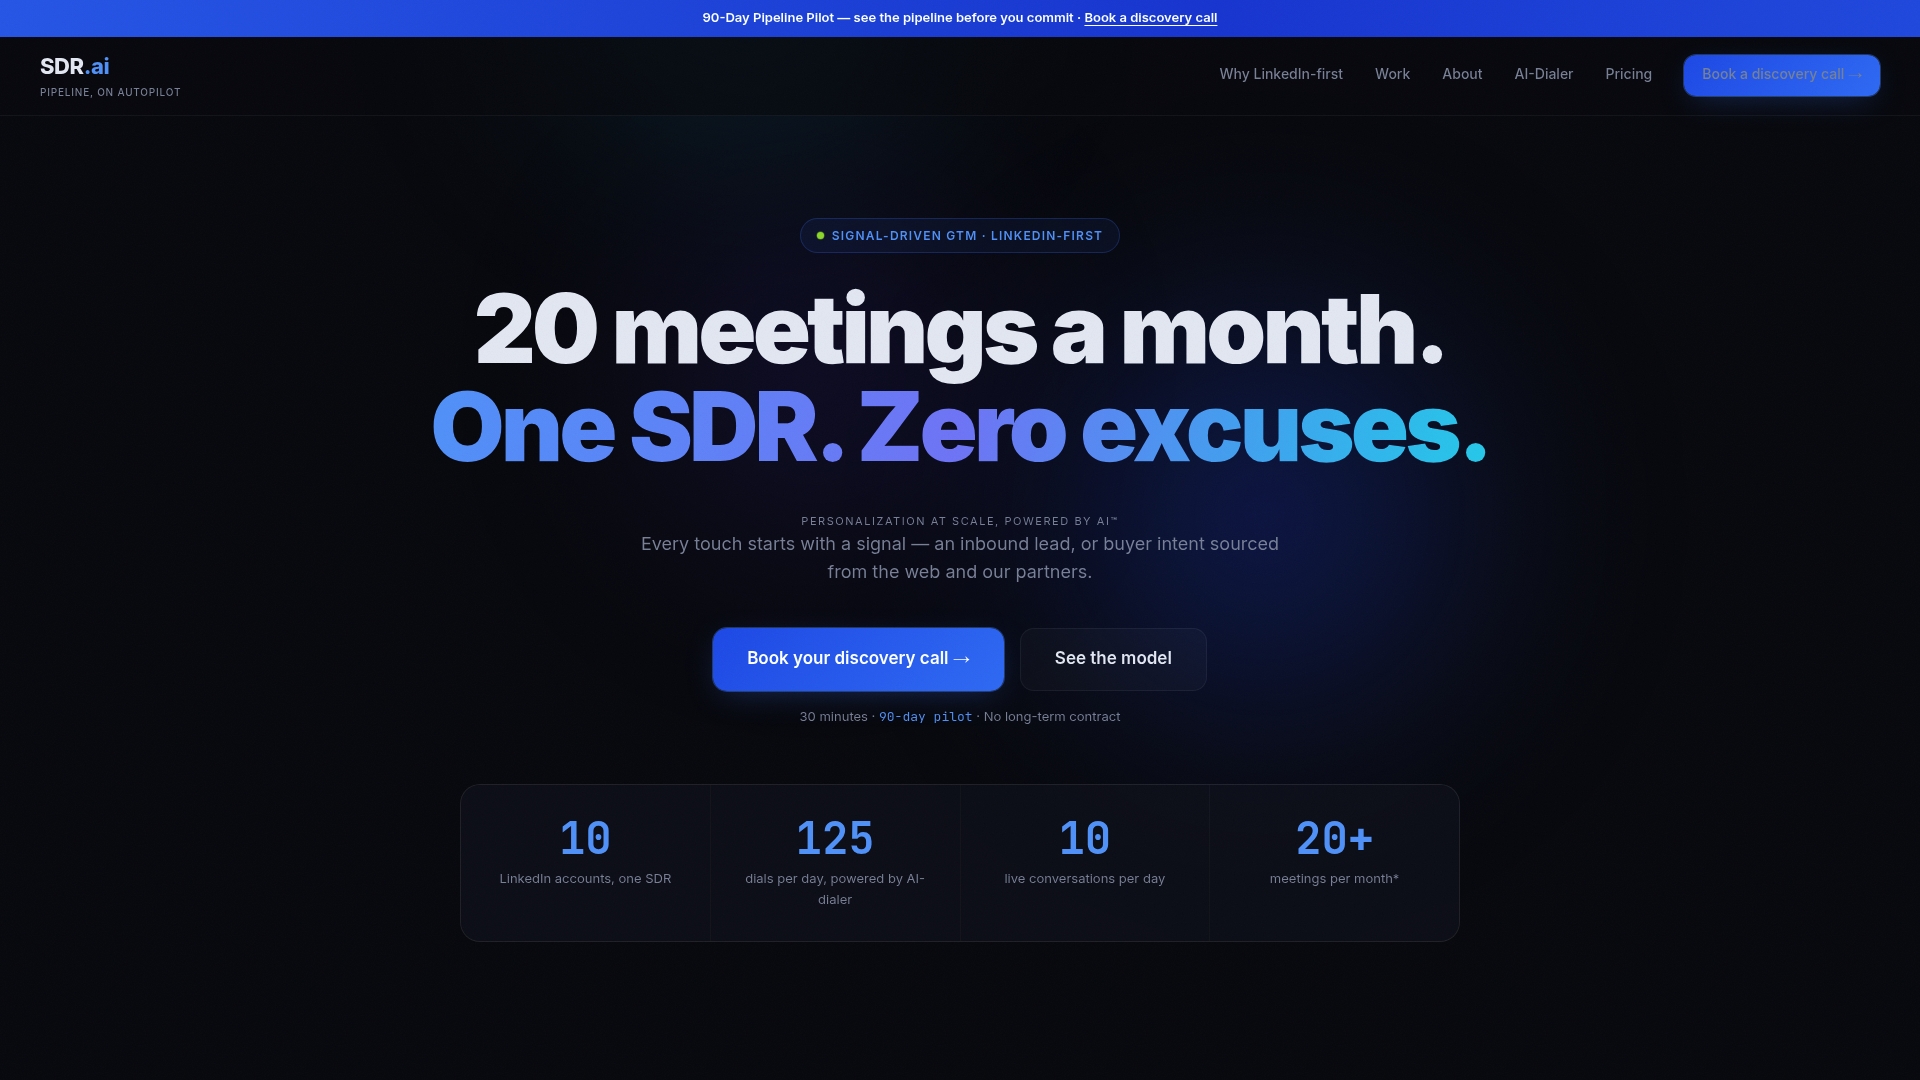
The math changes when the pipeline entering your funnel is already higher quality. Sdr's AI-driven LinkedIn outreach targets accounts showing real intent signals rather than blasting a purchased list, and its AI-Dialer increases connect volume through parallel dialing.
- Some clients report booking over 20 qualified meetings a month with minimal manpower when using this approach.
- Higher upstream qualification means fewer deals collapse mid-funnel, which lowers the coverage multiple needed to hit the same target with confidence.
Read the full methodology for how intent data feeds into outreach targeting.
Coverage Is a Trigger, Not a Comfort Blanket
That habit misses the entire point of the metric. Coverage only earns its keep when it's paired with inspection: stale deals pulled out, close dates verified, stage mix checked against historical conversion for that exact stage. A 4x ratio built on rotting deals is worse than a 2.5x ratio built on clean, active pipeline, because the first one will fail you in week twelve when there's no time left to react.
The teams that get the most from this discipline don't wait for the monthly business review. They treat a coverage dip as an immediate signal to open the CRM and find out why, the same day, not the same quarter.
— Chad
Book Qualified Meetings Without Inflating Your Pipeline Numbers
Building enough coverage the traditional way means throwing more reps at outbound and hoping volume compensates for weak targeting. Sdr takes a different route: AI-driven LinkedIn outreach and an AI-Dialer that identifies intent signals before a rep ever reaches out, so the pipeline you build is already qualified instead of padded.
That matters directly for your coverage math. When upstream qualification is tighter, you need less raw volume to hit the same target with confidence, and your weighted coverage stops lying to your forecast. Some clients report booking over 20 qualified meetings a month with a fraction of the manpower a traditional SDR team requires when using AI-driven outreach and dialer tools. If your coverage ratio looks thin heading into this quarter, the fix isn't necessarily more reps working the phones harder. Book a demo and see how the pipeline gets built before you decide whether you need 3x or 5x to feel confident in the number.
Sources
- Pipeline metrics overview — Rework resources
- Sales Pipeline Coverage – HubSpot
- Monday
- Weighted vs Unweighted Pipeline — ORM
- Pipeline coverage best practices — Clari
FAQ
What Is Sales Pipeline Coverage?
Sales pipeline coverage is the ratio of open pipeline value to the revenue target for a given period, used to check whether enough opportunities exist to hit the number.
What Are the Stages of a Sales Pipeline?
Stages vary by company, but a common structure runs from lead, to qualified, to proposal or demo, to negotiation, to closed won or closed lost.
How Do You Calculate Pipeline Coverage?
Divide total qualified open pipeline value for a period by the revenue target for that same period; a $2 million pipeline against a $500,000 target equals 4x coverage.
What Is a Good Pipeline Coverage Ratio?
Most teams target a coverage ratio that depends on historical win rates, so for example, a team with a 25% win rate would need a coverage ratio around four times their target.
Does More Pipeline Volume Always Improve Coverage?
No. Coverage built on stale or poorly qualified deals inflates the ratio without improving forecast accuracy, which is why tools like Sdr focus on intent-based, pre-qualified outreach rather than raw volume.