
Pipeline velocity equals (Opportunities × Average Deal Size × Win Rate) ÷ Sales Cycle Length in days, and the result tells you the dollar amount your pipeline generates every single day. A $2,000/day velocity means your current pipeline, left untouched, produces $2,000 in new revenue daily. Every input has to come from the same measurement window, or the number is fiction dressed up as math.
TL;DR:
- Using closed-won revenue for average deal size and including lost deals in sales cycle calculations ensures an accurate pipeline velocity measure.
- Improving each of the four levers—opportunities, deal size, win rate, and cycle length—by modest amounts compounds significantly in increasing velocity.
- Velocity benchmarks suggest $3,000 to $5,000 per day indicates a healthy pipeline for mid-market B2B companies, with below suggesting weaknesses and above indicating strong growth.
- Regular pipeline hygiene and standardizing qualification criteria prevent inflated numbers and maintain calculation accuracy over time.
- AI-driven outreach tools can quickly boost opportunities and shorten sales cycles without immediate headcount increases, especially when paired with baseline velocity measurement.
Table of Contents
- What the Pipeline Velocity Formula Actually Measures
- A Worked Example: Turning the Formula Into a Forecast
- How to Measure Pipeline Inputs Without Fooling Yourself
- The Four Levers That Actually Move Velocity
- What Good Pipeline Velocity Looks Like
- Common Mistakes That Wreck Your Velocity Number
- Where AI-Driven Outreach Fits Into the Velocity Levers
- Which Lever Should You Fix First?
- A Faster Way to Move the Opportunity and Cycle-Length Levers
- Sources
What the Pipeline Velocity Formula Actually Measures
The formula looks simple on paper: V = (O × D × W) ÷ C. Opportunities (O) times average deal size (D) times win rate (W), divided by sales cycle length (C) in days. But each variable has a specific, correct way to pull it from your CRM, and most teams get at least one of them wrong.
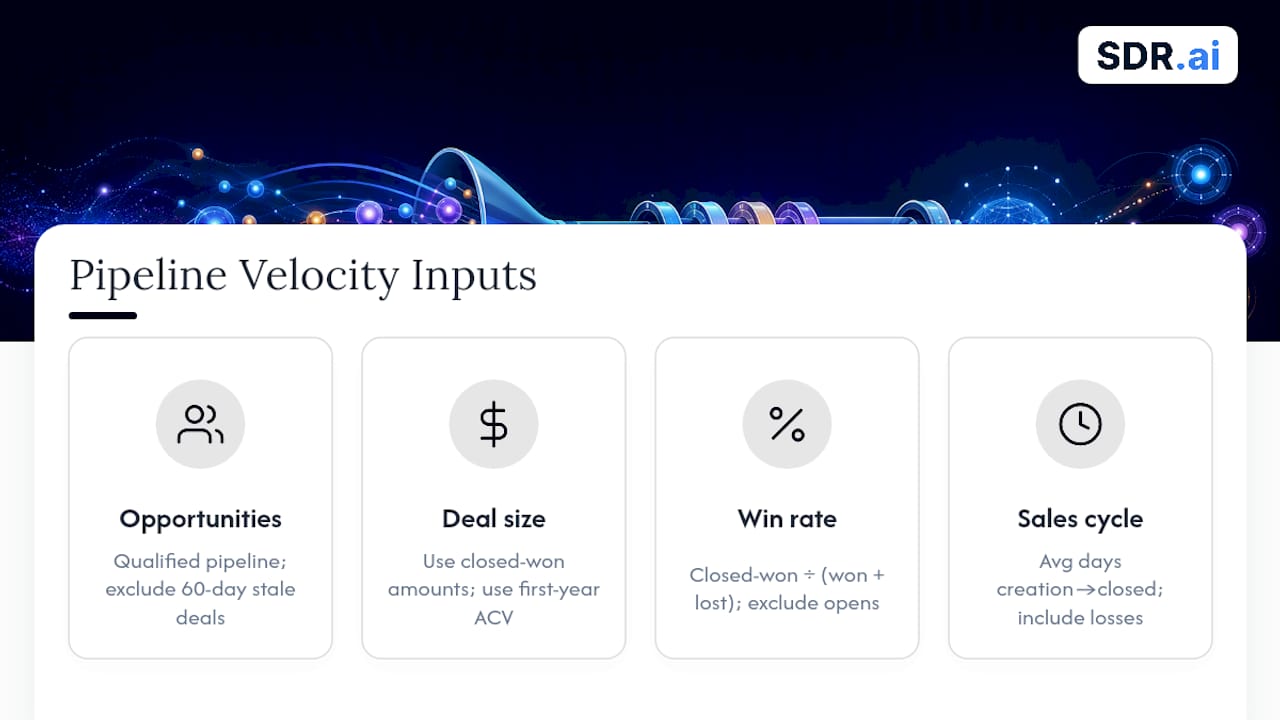
Opportunities means qualified pipeline, not raw leads. Count deals that have cleared your qualification bar (whatever stage that lands at in HubSpot, Salesforce, or your CRM of choice) and are actively progressing. Don't count deals sitting untouched for 60 days.
Average deal size should come from closed-won deals only, not from open pipeline estimates reps entered optimistically at the top of the funnel. For recurring revenue businesses, use first-year contract value or ACV rather than total contract value, so a three-year deal doesn't skew the average against one-year deals, a point GTM Layer emphasizes when defining the formula's inputs.
Win rate is closed-won divided by (closed-won plus closed-lost). Open deals don't belong in this calculation at all, since they haven't resolved yet.
Sales cycle length is the average number of days from opportunity creation to a closed outcome, and that average has to include lost deals, not just wins. Excluding losses shortens the average artificially and inflates velocity.
Pick a lookback window and stick to it. Ninety days captures recent behavior but can be thin for long-cycle B2B deals. One hundred eighty days smooths out seasonal noise but reacts slower to real change. Whichever you choose, apply it to every input, every time.
A Worked Example: Turning the Formula Into a Forecast
Here's the math with real numbers, following the structure The CRO Report uses to walk through velocity calculations.
- Opportunities: 40 qualified deals in the pipeline over the last 90 days.
- Average deal size: $10,000 in closed-won ACV.
- Win rate: 25%, based on 10 wins out of 40 closed deals.
- Sales cycle length: 50 days average, wins and losses combined.
- Calculation: (40 × $10,000 × 0.25) ÷ 50 = $2,000/day.
Extend that out and $2,000/day becomes roughly $60,000 a month, or about $180,000 a quarter, assuming pipeline composition holds steady. That's the number to compare against quota. If your quarterly target is $250,000 and your velocity math projects $180,000, you've found a shortfall weeks before the quarter closes, not after it's too late to react.
How to Measure Pipeline Inputs Without Fooling Yourself
The formula is only as good as the discipline behind it. Fluid CRM points out that many teams calculate velocity using optimistic, unresolved numbers, which produces a figure that looks great and means nothing.
- Always calculate average deal size from closed-won revenue, never from open pipeline values reps entered as estimates.
- Always calculate win rate from closed deals (won plus lost), never from a mix of open and closed opportunities.
- Include lost deals when averaging sales cycle length. A deal that died after 120 days still tells you something about your process.
- Run CRM hygiene monthly: close out stale opportunities, verify that create dates and stage timestamps are accurate, and confirm reps are logging stage changes in real time.
- Standardize what "qualified" means across every rep and team, so one person's stage 2 isn't another's stage 4.
- For multi-year contracts, use first-year value in the deal-size calculation. For renewals, treat them as a separate cohort so they don't distort new-business velocity. For partial bookings, count only the confirmed, signed portion.
Pro Tip: Set a recurring calendar block, once a month, just for pipeline hygiene. Twenty minutes of cleanup on stale deals prevents hours of confusion later when your forecast and your actual revenue don't match.
The Four Levers That Actually Move Velocity
Because the formula multiplies its inputs, improving each one by even a modest amount compounds fast. It compounds to something closer to 46 to 48% higher velocity, because you're multiplying gains, not stacking them.
Here's what moves each lever in practice:
- Opportunities: Add SDR capacity, tighten targeting around your ideal customer profile, and personalize outreach cadence instead of blasting generic sequences. This lever takes the longest to show results because top-of-funnel work has a lag.
- Average deal size: Rework packaging and pricing tiers, build in cross-sell and upsell motions, and structure multi-year contracts around strong first-year value. Expect a slower payoff here too, since pricing changes take a sales cycle or two to show up in closed data.
- Win rate: Tighten qualification with a framework like MEDDIC or BANT, sharpen your sales playbook, and invest in demo and negotiation training. This lever tends to move fastest, since it's about how reps handle deals already in motion.
- Sales cycle length: Remove procurement friction, get decision criteria on the table early, and speed up contracting and legal review. Cycle-length fixes often show results within a quarter, since they attack process, not behavior change.
The lesson buried in that multiplication: you don't need one dramatic fix. You need four modest ones happening at the same time, as PipelineGrader's benchmark framework lays out when mapping levers to expected timeframes.
What Good Pipeline Velocity Looks Like
Benchmarks vary by deal size and sales motion, but mid-market B2B companies typically land somewhere in the $3,000 to $5,000 per day range for healthy velocity. Below that, something in your funnel is underperforming. Well above it, you're likely in a strong growth phase or your inputs need a sanity check.
| Velocity range (mid-market B2B) | What it typically signals | Suggested action |
|---|---|---|
| Below $3,000/day | Weak opportunity flow, low win rate, or bloated cycle length | Diagnose which lever is lagging before spending on more top-of-funnel activity |
| $3,000 to $5,000/day | Healthy, sustainable pipeline performance | Maintain current process, watch for early warning signs of decay |
| Above $5,000/day | Strong growth momentum, or inflated inputs | Verify the calculation uses closed-won data before scaling spend |
Once you know your daily velocity, multiply it by 90 to get a rough quarterly pipeline output, then compare that against your revenue target to calculate coverage ratio. If projected output consistently falls short of quota, that's your signal to add headcount or increase demand-generation spend, not just push reps harder on existing deals.
Common Mistakes That Wreck Your Velocity Number
Most bad velocity numbers trace back to a handful of repeatable errors.
- Using open pipeline values instead of closed-won revenue for average deal size, which inflates the number before you even start.
- Mixing lookback windows across inputs, like calculating win rate over 90 days but cycle length over a full year.
- Leaving lost deals out of the sales-cycle length average, which artificially shortens your cycle and overstates velocity.
- Skipping regular pipeline audits, which lets stale deals and inaccurate close dates quietly distort every downstream number.
A short monthly audit, two to three hours, catching dead deals and confirming timestamps, fixes most of this before it compounds into a bad forecast.
Where AI-Driven Outreach Fits Into the Velocity Levers
Two of the four levers, opportunities and cycle length, respond directly to how fast and how precisely you can engage the right buyers. AI-driven outreach on LinkedIn, paired with an AI dialer built for parallel calling, is one practical way teams add qualified opportunities without scaling headcount, and shortens cycle length by getting decision-makers on the phone faster.
If you're testing whether a new outreach approach actually moves velocity, keep it simple:
- Calculate your baseline velocity using the rules above before making any changes.
- Run a 30 to 60 day pilot with the new approach, keeping every other input untouched.
- Recalculate velocity using the identical lookback window and input definitions.
- Compare pre- and post-pilot numbers, not gut feel about "things seem busier."
Which Lever Should You Fix First?
Start with your coverage ratio. If projected pipeline output falls well short of quota, prioritize opportunities before touching anything else. If coverage looks fine but deals crawl through the funnel, attack cycle length and procurement friction instead.
Smaller teams usually get more return from fixing win rate and cycle length than from throwing more spend at top-of-funnel activity. Those two levers respond faster and cost less to move. Run the calculation this week, find your weakest input, and run one focused experiment against it before touching the other three.
— Chad
A Faster Way to Move the Opportunity and Cycle-Length Levers
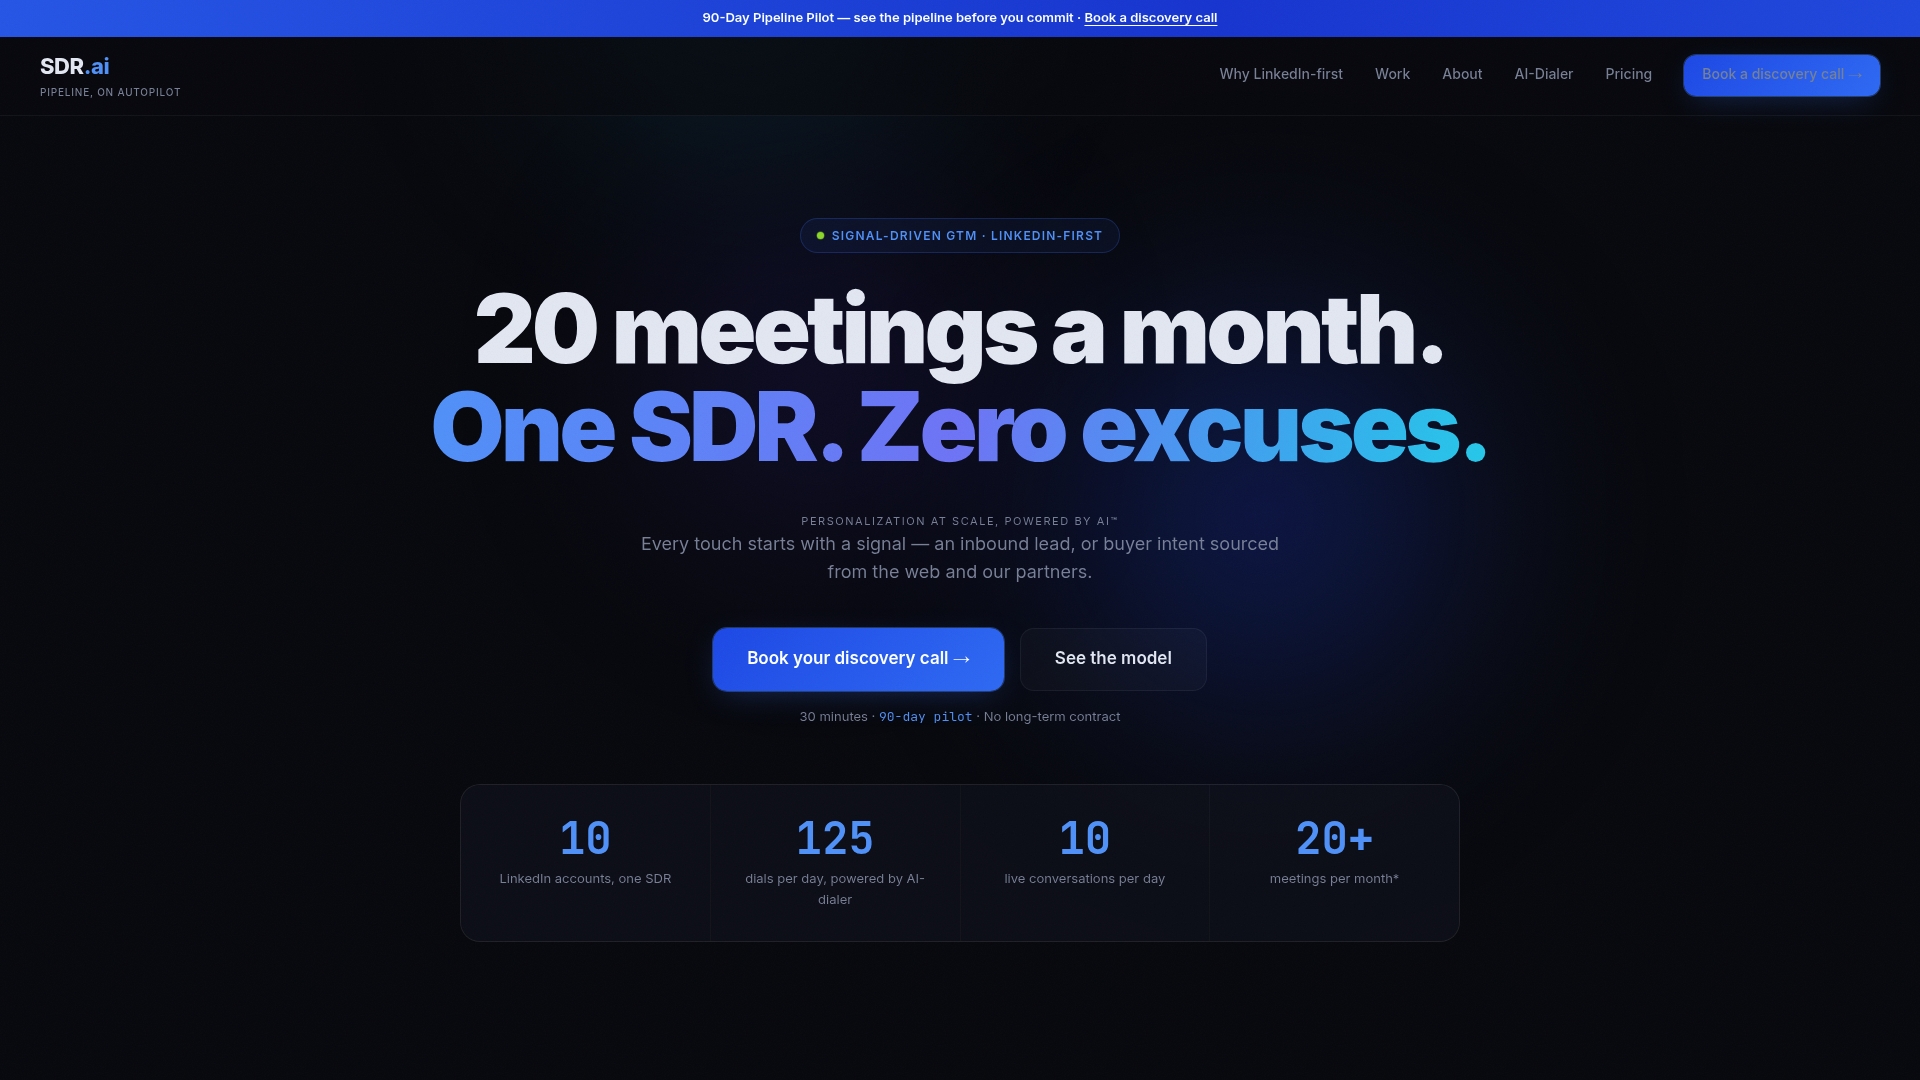
A service like SDR.ai gives you a direct lever on two of the four numbers in this formula: opportunities and cycle length, without hiring and ramping an in-house SDR team first. The service combines AI-driven LinkedIn outreach with an AI dialer for parallel calling, built to book qualified meetings and get decision-makers on the phone faster than a traditional outbound motion.
Before you bring on any outreach engagement, calculate your baseline velocity using the closed-won rules covered above. Run the engagement, then recalculate using the same lookback window and input definitions, so the before-and-after comparison actually means something. If you want to see how the approach fits your pipeline, book a demo and walk through your current numbers with the team.
Sources
- What Is Pipeline Velocity? The Formula and How to Improve It - GTM Layer
- Pipeline Velocity: The Formula, the 4 Levers & How to Improve It | PipelineGrader
- Pipeline Velocity Formula (And Why Yours Is Too High) - Fluid CRM Blog
- Pipeline Velocity: How Fast Revenue Moves - The CRO Report